
Author: Rahul Kumar Goyal Co-Authors: Vivek Kanna Jayaprakash, Panga Karthik, Twinkle Viswanathan, Tejaswini R
Problem
When managing machines in a production line, maintenance timing is crucial. If maintenance is too frequent, resources and money are wasted. If it is too infrequent, machines can break down, leading to high repair costs and lost production. Optimal maintenance, performed when needed, prevents issues and minimizes costs.
Proposed Solution
We propose using data-driven insights from Snowflake Cortex and traditional ML models to optimize resource allocation and schedule maintenance activities at the most cost-effective and least disruptive times. Anomaly detection models on top of forecasted machine data will help identify deviations from normal equipment performance or operating conditions.
We also developed an Overall Equipment Efficiency (OEE) Operations Dashboard, which measures productive manufacturing time by accounting for all losses.
How Do We Build It?

Our solution involves collecting sensor data from machinery, such as temperature, vibration, motor rpm, and motor amps from Cirrus Link. This data is then trained using data science techniques to forecast machine environment parameters with Facebook Prophet. Additionally, anomaly detection models like Isolation Forest and LSTM are applied on top of the forecasted data to predict potential machine failures. Alternatively, the Snowpark Cortex function for anomaly detection has also been used on top of the forecasted values.
How Do We Use It?
The solution is presented in the form of an application consisting of four tabs:
Problem Statement: This tab outlines the objective of the solution and the approach taken to address it.
Exploratory Data Analysis (EDA): Here, users can preview the raw data and observe patterns in the machine data. This tab also includes the time series decomposition of the data, breaking it down into trend, seasonal, and residual components.
Time Series Forecasting: This section displays the forecasted values for all features in chart form, based on the fitted model. The forecasts predict the next day’s values.
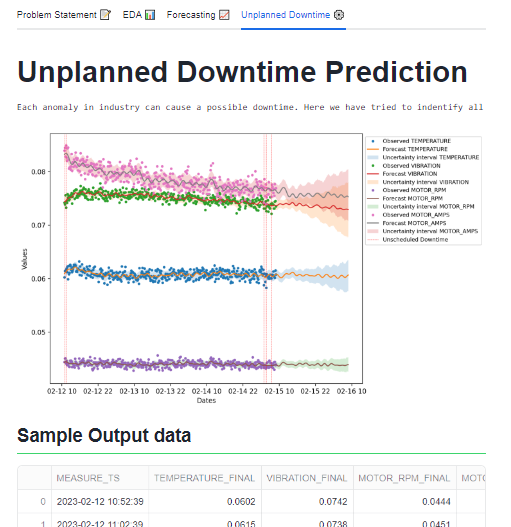
Unplanned Downtime: This tab identifies anomalies in the forecasted values, as each anomaly can indicate potential downtime. Anomalies are detected using a 0.01 confidence interval. Alternatively, we utilized Snowflake Cortex functions to detect anomalies in the forecasted data.
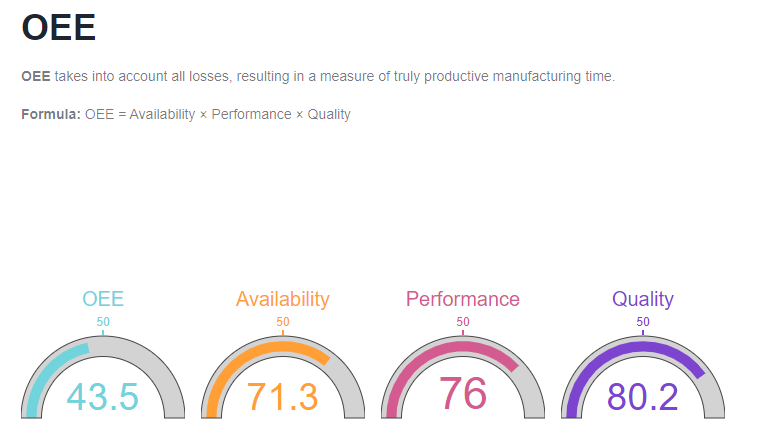
The Overall Equipment Efficiency (OEE) Operations Dashboard helps us to understand if the factory is operating at its max efficiency.
The OEE formula combines these factors: OEE = Availability × Performance × Quality. This calculation provides a comprehensive measure of manufacturing efficiency.
Future Enhancements
Currently, the dataset used is from 1 machine in 4 days where the readings were taken at a frequency of 10 minutes. The data frequency could be reduced to a few seconds to proactively identify potential anomalies giving us spare time to act upon the fault.