Introduction
Dive into real-life use cases showcasing how our solutions contribute to energy efficiency, waste reduction, pollution control, and much more. Discover the tangible impact our innovations are having on sustainability in the manufacturing sector.
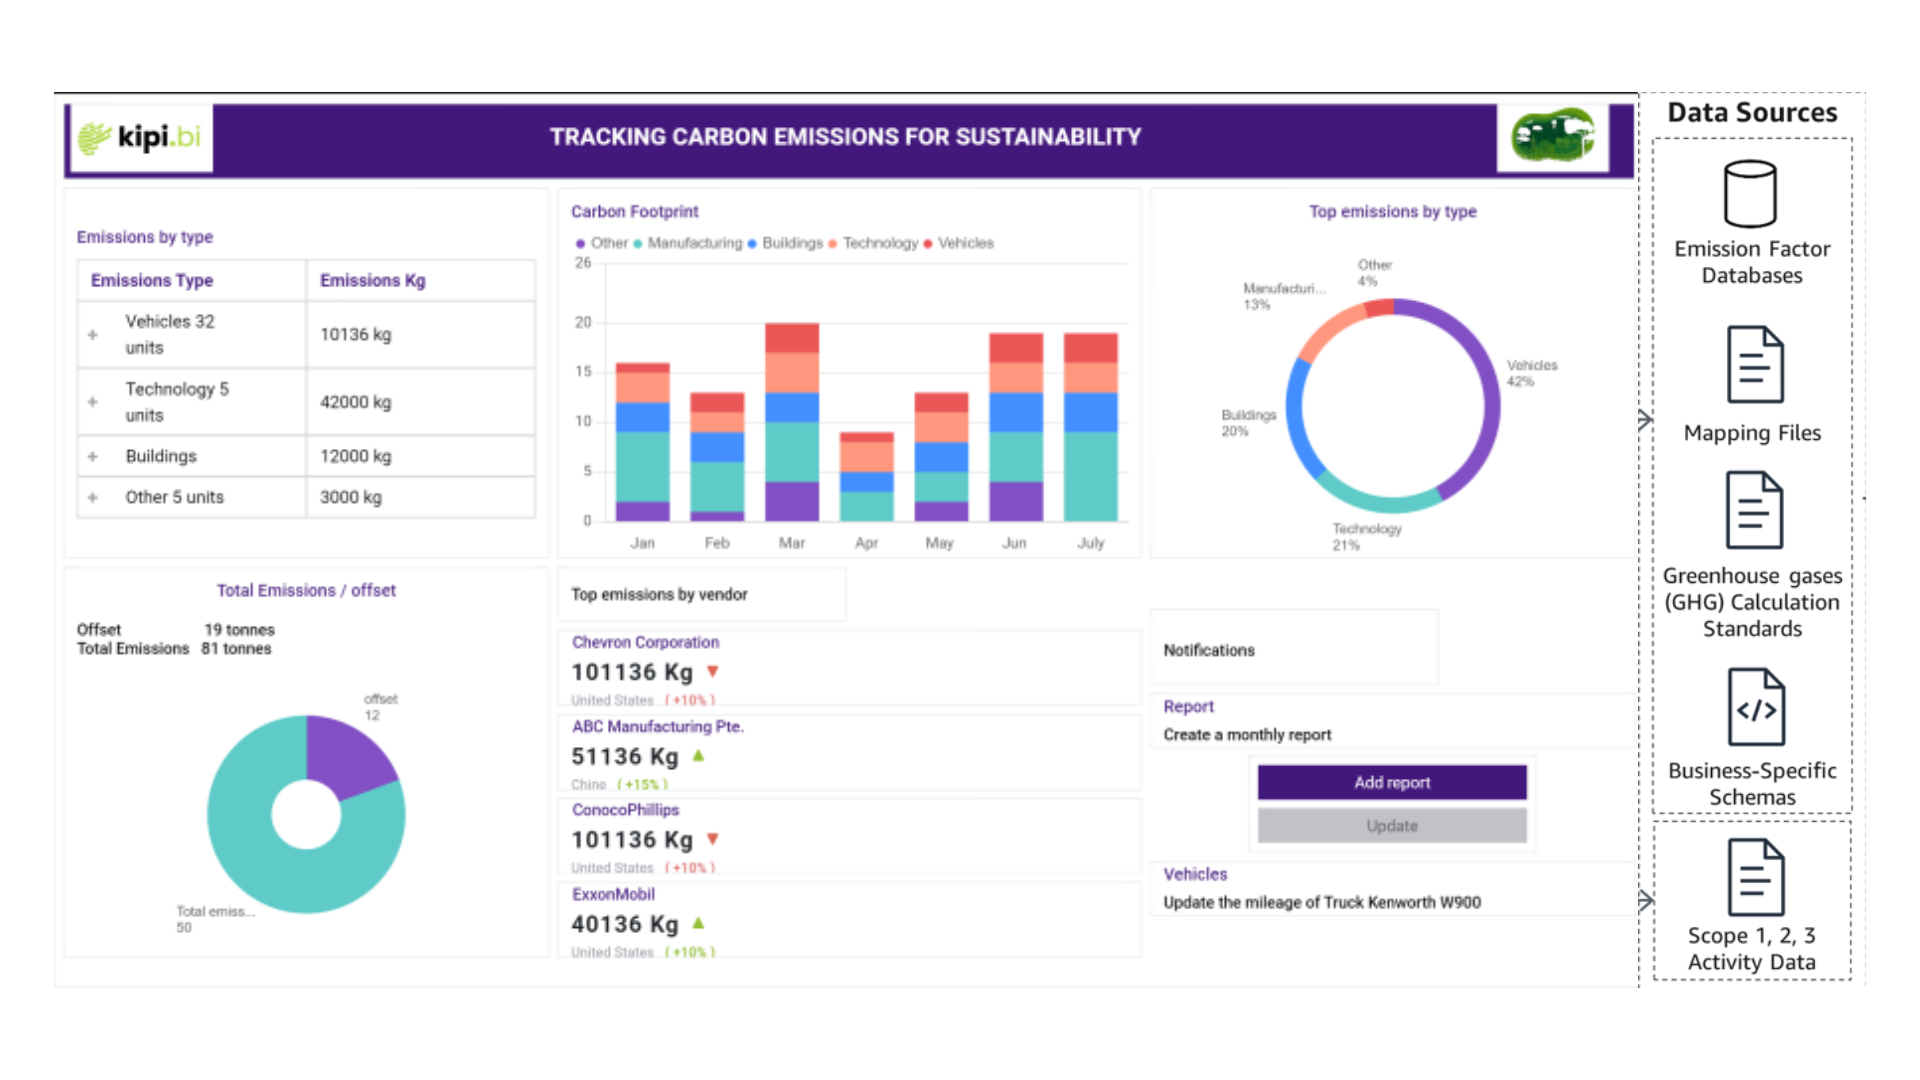
Tracking Carbon Emissions for Sustainability
Business Challenge
Manufacturing companies encounter the formidable task of precisely monitoring carbon emissions throughout their intricate supply chains to adhere to regulatory mandates and uphold their sustainability commitments.
Solution
Harness the versatility of Snowflake’s data architecture to seamlessly integrate a plethora of data sources, encompassing manufacturing processes, transportation logs, and energy consumption metrics. Deploy IoT sensors and intelligent metering systems at strategic junctures within the supply chain to capture real-time emission data accurately. Implement cutting-edge machine learning algorithms within the Snowflake platform to scrutinize intricate data patterns, empowering proactive decision-making and the execution of targeted emission reduction initiatives.
Impact
Facilitates meticulous measurement and transparent reporting of carbon emissions, augmenting organizational transparency and accountability in sustainability endeavors and regulatory compliance. Pinpoints emission hotspots across the supply chain, paving the way for precision-targeted interventions aimed at curbing carbon emissions in areas of utmost significance. Drives optimization of resource allocation and operational efficiency, culminating in tangible cost savings and reinforcing the company’s competitive edge
Key Metrics for Tracking Carbon Emissions
Carbon Emission Intensity (CEI):
Explanation: This KPI measures the amount of carbon emissions generated per unit of production output. A lower CEI indicates higher efficiency in resource utilization and reduced environmental impact.
Emission Reduction Rate (ERR):
Explanation: ERR quantifies the percentage reduction in carbon emissions achieved over a specific period. It reflects the effectiveness of emission reduction strategies implemented as a result of tracking and analyzing emission data.
Emission Hotspot Detection Accuracy (EHDA):
Explanation: EHDA measures the accuracy of identifying emission hotspots within the supply chain. It assesses the effectiveness of the machine learning algorithms in pinpointing areas with the highest carbon emissions, enabling targeted interventions.
Resource Utilization Efficiency (RUE):
Explanation: RUE evaluates the efficiency of resource utilization in production processes relative to the carbon emissions generated. A higher RUE indicates optimal resource utilization, leading to reduced emissions per unit of output.
Carbon Emission Reporting Timeliness (CERT):
Explanation: CERT measures the percentage of emission reports submitted within the stipulated timeframe. Timely reporting enhances transparency and accountability, demonstrating the organization’s commitment to sustainability and regulatory compliance.
Enhancing Energy Efficiency in Building Operations
Business Challenge
Manufacturing companies and facility managers struggle to optimize energy consumption in buildings to reduce environmental impact and operating costs.
Solution
Integrate IoT sensors, building automation systems, and utility meters with Snowflake’s data platform to capture comprehensive energy usage data. Utilize Snowflake’s scalability and performance to process vast volumes of real-time data and historical trends. Implement predictive analytics and AI algorithms to identify energy wastage patterns and recommend efficiency measures.
Impact
Reduces building energy consumption and carbon footprint, aligning with ESG objectives. Lowers operational costs by optimizing energy usage and scheduling maintenance tasks. Enhances occupant comfort and satisfaction by maintaining optimal indoor environmental quality.
Key Metrics for Enhancing Energy Efficiency
Energy Efficiency Ratio (EER):
Explanation: EER measures the effectiveness of energy utilization within buildings. It is calculated by dividing the useful energy output by the total energy input.
Occupant Comfort Index (OCI):
Explanation: OCI assesses the level of comfort experienced by building occupants based on factors such as temperature, humidity, and air quality. It can be measured through surveys, sensor data, or comfort indices.
Energy Waste Detection Rate (EWDR):
Explanation: EWDR measures the efficiency of detecting and addressing energy wastage within buildings. It is calculated by comparing the detected instances of energy wastage to the total potential instances of wastage.
Maintenance Cost Reduction Percentage (MCRP):
Explanation: MCRP quantifies the reduction in maintenance costs achieved through optimized energy usage and maintenance scheduling. It is calculated by comparing the total maintenance costs before and after implementing energy efficiency measures, then expressing the reduction as a percentage of the initial costs.
Environmental Impact Mitigation Index (EIMI):
Explanation: EIMI evaluates the effectiveness of energy efficiency initiatives in mitigating the environmental impact of building operations. It considers factors such as carbon emissions reduction, resource conservation, and pollutant emissions.
Sustainable Investment Decision Making
Business Challenge
Investors in manufacturing encounter challenges in integrating environmental considerations into their decision-making processes to adhere to ESG principles and mitigate financial risks.
Solution
Utilize Snowflake’s data architecture to aggregate diverse ESG-related datasets, encompassing carbon footprint, water usage, and waste management. Leverage advanced analytics and machine learning models within Snowflake to assess the environmental performance of potential investments. Integrate real-time market data and ESG ratings to evaluate the financial implications of environmental risks and opportunities.
Impact
Enables manufacturing investors to make informed decisions that balance environmental sustainability with financial returns. Enhances risk management by identifying companies susceptible to environmental risks, such as regulatory penalties or supply chain disruptions. Attracts investors committed to social responsibility and bolsters the industry’s reputation for sustainability.
Key Metrics for Sustainable Investment
ESG Integration Efficiency (ESGIE):
Measures the speed and accuracy of integrating diverse ESG datasets into investment decision-making processes using Snowflake’s data architecture.
Environmental Performance Assessment Ratio (EPAR):
Evaluates the effectiveness of Snowflake-enabled analytics in assessing the environmental performance of potential investments relative to financial returns.
Risk-Adjusted Sustainability Score (RASS):
Quantifies the level of environmental risk mitigation achieved through Snowflake-powered analytics, considering both financial risks and ESG principles in investment strategies.
Market Response Index (MRI):
Gauges the market’s response to environmentally informed investment decisions facilitated by Snowflake, reflecting investor confidence and market perception of sustainability initiatives.
Investor Attraction Rate (IAR):
Measures the rate at which socially responsible investors are attracted to manufacturing investments leveraging Snowflake’s environmental analytics, enhancing the industry’s appeal and reputation for sustainability.
Monitoring and Reporting on Sustainable Manufacturing Practices
Business Challenge
Manufacturing industries confront the need to embrace sustainable methodologies to mitigate environmental harm and fulfill consumer demand for ethically sourced goods.
Solution
Utilize Snowflake’s data architecture to aggregate data from IoT sensors, satellite imagery, weather forecasts, and soil quality assessments. Implement machine learning algorithms within Snowflake to evaluate the impact of manufacturing processes on environmental factors such as soil health, water usage, and biodiversity. Provide manufacturing teams with actionable insights and best practices through Snowflake-powered analytics dashboards.
Impact
Improves manufacturing efficiency and resilience to environmental challenges while minimizing ecological impact. Enhances transparency and consumer confidence by enabling traceability and certification of sustainably manufactured products. Facilitates compliance with environmental regulations and sustainability standards in the manufacturing industry.
Key Metrics for Sustainable Manufacturing
Sustainability Adoption Rate (SAR):
Measures the speed and extent of adoption of sustainable practices within manufacturing operations leveraging Snowflake’s data-driven insights.
Environmental Impact Reduction Ratio (EIRR):
Evaluates the effectiveness of Snowflake-enabled analytics in reducing the environmental impact of manufacturing processes, considering factors like soil health, water usage, and biodiversity conservation.
Traceability Assurance Index (TAI):
Quantifies the level of assurance provided by Snowflake-powered analytics in ensuring product traceability and certification, enhancing transparency and consumer trust.
Compliance Adherence Score (CAS):
Assesses the degree to which manufacturing operations comply with environmental regulations and sustainability standards, facilitated by insights derived from Snowflake data analytics.
Resilience Enhancement Index (REI):
Gauges the improvement in manufacturing resilience to environmental challenges achieved through Snowflake-powered analytics, indicating increased operational stability and sustainability in the face of ecological risks.
Green Fleet Management for Transportation Companies
Business Challenge
Transportation firms grapple with reducing fuel consumption and emissions from their vehicle fleets while preserving operational efficiency and fulfilling customer demand.
Solution
Incorporate telematics data, route optimization algorithms, and vehicle performance metrics into Snowflake’s data platform. Utilize Snowflake’s data warehousing capabilities for real-time analysis of fuel efficiency, driver behavior, and vehicle maintenance requirements. Implement predictive maintenance models to reduce downtime and enhance fleet utilization.
Impact
Decreases fuel consumption and greenhouse gas emissions, aligning with environmental sustainability objectives. Reduces operational expenses via optimized route planning, fuel efficiency, and maintenance scheduling. Improves customer satisfaction by ensuring timely deliveries and minimizing environmental impact.
Key Metrics for Green Fleet Management
Fuel Efficiency Improvement Rate (FEIR):
Measures the rate of improvement in fuel efficiency achieved through Snowflake-powered fleet optimization, reflecting progress towards environmental sustainability goals.
Emission Reduction Percentage (ERP):
Quantifies the percentage reduction in greenhouse gas emissions resulting from the implementation of Snowflake-enabled fleet optimization strategies.
Maintenance Cost Savings Ratio (MCSR):
Evaluates the ratio of cost savings achieved through predictive maintenance models to the total maintenance costs, indicating the efficiency gains from Snowflake-powered fleet optimization.
On-Time Delivery Performance (OTDP):
Tracks the percentage of deliveries made on schedule following the implementation of Snowflake-powered fleet optimization, enhancing customer satisfaction and operational efficiency.
Environmental Impact Mitigation Index (EIMI):
Gauges the overall effectiveness of Snowflake-powered fleet optimization in mitigating environmental impact, considering factors such as fuel consumption reduction and emission reduction, while maintaining operational efficiency.
Waste Reduction and Recycling Optimization in Manufacturing
Business Challenge
Manufacturing enterprises encounter obstacles in reducing waste generation and streamlining recycling operations to minimize environmental impact and operational expenses.
Solution
Integrate IoT sensors, production line data, and supply chain information into Snowflake’s data platform. Utilize Snowflake’s data warehousing capabilities to scrutinize waste generation patterns, identify inefficiencies, and monitor recycling rates. Implement machine learning algorithms to predict waste generation and optimize recycling processes, including material recovery and reuse.
Impact
Decreases landfill waste and conserves resources by maximizing recycling and reuse opportunities. Reduces waste disposal expenses and enhances operational efficiency within manufacturing facilities. Demonstrates commitment to sustainability, attracting environmentally conscious customers and partners.
Key Metrics for Waste Reduction & Recycling
Waste Generation Efficiency (WGE):
Measures the efficiency of waste reduction efforts by comparing the amount of waste generated per unit of production output before and after implementing the Snowflake-integrated waste management system.
Recycling Rate Improvement (RRI):
Tracks the percentage increase in recycling rates achieved through optimized recycling processes and material recovery facilitated by the Snowflake-integrated system.
Waste Disposal Cost Savings (WDCS):
Quantifies the cost savings achieved in waste disposal expenses following the implementation of the Snowflake-integrated waste management system, contributing to operational efficiency and reduced environmental impact.
Resource Recovery Ratio (RRR):
Evaluates the ratio of recovered materials (e.g., recycled materials, reused components) to total waste generated, indicating the effectiveness of resource conservation efforts enabled by the Snowflake-integrated system.
Sustainability Perception Index (SPI):
Assesses stakeholders’ perception of the organization’s commitment to sustainability based on its waste reduction and recycling initiatives, enhancing brand reputation and attracting environmentally conscious stakeholders.
Water Conservation and Management
Business Challenge
Manufacturing enterprises face challenges in effectively managing water resources, minimizing water pollution, and ensuring sustainable water usage practices to meet regulatory requirements and promote environmental stewardship.
Solution
Incorporate data from soil moisture sensors, weather forecasts, irrigation systems, and water quality monitoring devices into Snowflake’s data architecture. Leverage Snowflake’s data processing capabilities to analyze water usage patterns, assess soil moisture levels, and optimize irrigation schedules. Implement predictive analytics models within Snowflake to anticipate water demand, prevent excessive irrigation, and minimize water waste.
Impact
Preserves water resources, reducing the risk of operational disruptions and associated costs in manufacturing processes. Minimizes water pollution by preventing the release of harmful substances into water bodies, ensuring compliance with environmental regulations. Demonstrates the company’s commitment to sustainability and responsible water management practices, enhancing its reputation among customers, stakeholders, and regulatory agencies.
Key Metrics for Water Conservation
Water Usage Efficiency (WUE):
Measures the efficiency of water utilization in agricultural practices by comparing the amount of water applied to crops to the actual water requirements determined through Snowflake-enabled analysis.
Irrigation Optimization Rate (IOR):
Tracks the percentage improvement in irrigation practices achieved through Snowflake-powered analytics, reducing water wastage and enhancing crop yield while minimizing environmental impact.
Soil Moisture Conservation Index (SMCI):
Evaluates the effectiveness of irrigation scheduling based on Snowflake-derived soil moisture analysis in conserving soil moisture levels, promoting sustainable agriculture and resilience to drought conditions.
Water Pollution Prevention Score (WPPS):
Quantifies the effectiveness of water pollution prevention measures implemented based on Snowflake-derived insights, reducing agricultural chemical runoff and soil erosion, and safeguarding water quality.
Regulatory Compliance Assurance (RCA):
Assesses the degree of adherence to water management regulations and sustainability standards achieved through Snowflake-powered analytics, enhancing regulatory compliance and demonstrating commitment to environmental stewardship in agriculture.
Air Quality Monitoring and Pollution Control in Urban Environments
Business Challenge
Urban areas are challenged by air pollution stemming from vehicular emissions, industrial activities, and various sources, resulting in detrimental health effects and environmental deterioration.
Solution
Integrate data from air quality sensors, traffic cameras, meteorological stations, and pollutant emissions inventories into Snowflake’s data architecture. Utilize Snowflake’s data processing capabilities to analyze real-time air quality data, pinpoint pollution hotspots, and evaluate the efficacy of mitigation strategies. Implement predictive modeling to forecast air quality trends, anticipate pollution episodes, and guide policy decisions.
Impact
Enhances public health by reducing exposure to harmful air pollutants. Supports evidence-based policymaking and regulatory enforcement to curb air pollution. Elevates the livability and appeal of urban areas, fostering economic growth and societal well-being.
Key Metrics for Air Quality Monitoring
Air Quality Improvement Index (AQII):
Tracks the improvement in air quality achieved through Snowflake-powered analysis, reflecting the effectiveness of pollution mitigation strategies in reducing harmful pollutants.
Pollution Hotspot Detection Accuracy (PHDA):
Measures the accuracy of identifying pollution hotspots within urban areas using Snowflake-derived insights, facilitating targeted interventions to reduce pollutant emissions and improve air quality.
Policy Impact Assessment Score (PIAS):
Evaluates the impact of policy interventions informed by Snowflake-powered predictive modeling on air quality improvement and public health outcomes, supporting evidence-based policymaking and regulatory enforcement.
Public Health Enhancement Ratio (PHER):
Quantifies the ratio of reduced health risks associated with air pollution-related illnesses to the total population, demonstrating the positive impact of improved air quality on public health outcomes.
Urban Livability Index (ULI):
Assesses the overall livability and attractiveness of urban areas based on improvements in air quality achieved through Snowflake-enabled pollution monitoring and mitigation efforts, contributing to economic growth and societal well-being.
